Hello to all the readers.
I have learnt about the cumulative flow diagram in Jira. And thought to pen down my learning.
Following is a sample cumulative flow diagram.
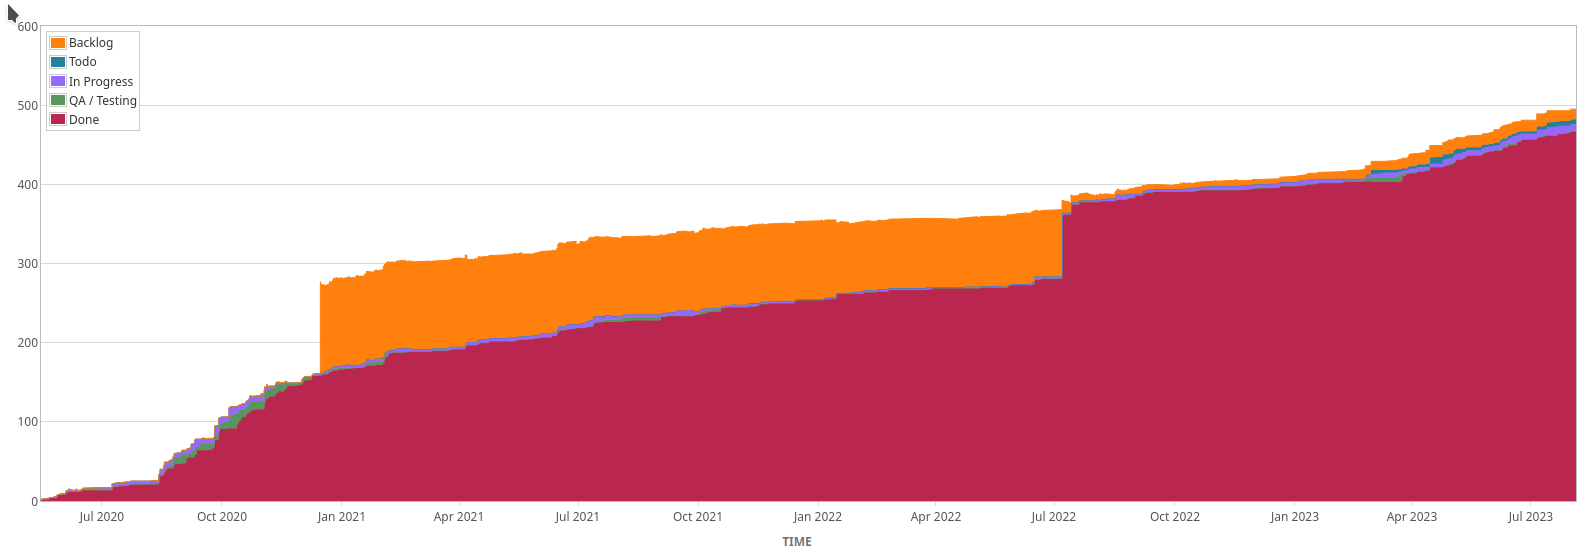
This diagram shows number of issues in different statuses over a period of time. This means issues placed in the columns of Jira board are taken into account. The columns are actually the statuses that are shown in the cumulative flow diagram.
Benefit of Cumulative Flow Diagram
The main benefit of this diagram is to see how project is running. Let us suppose the gap between Backlog and Done status is widening/increasing, then it means work is not getting finished on a right pace. This tells the throughput, i.e. the work done over a period of time.
And if the gap between Backlog and Done status is narrowing/decreasing, then it tells that as the issues are getting created, those are also being completed. So, the issue comes and goes in Done.
This diagram can also highlight the stage where issues get stuck. Suppose there is a column “QA” and the diagram shows large area for QA column, then it tells that QA is a bottleneck due to which issues are stuck.