Hello to all my dear friends!
In this post, I’ll describe some key values that appear in the network tab of web browsers. I primarily use Firefox than Chrome but for the work purpose I use Chrome as well. Both the browsers or even others have developer tools. And there is an important section in the developer tools. It is named as Network.
The network tab can also be called as Network panel or Network console. I like calling it console but anyways.
Below is the screenshot of vultr.com and the network tab in Google Chrome.
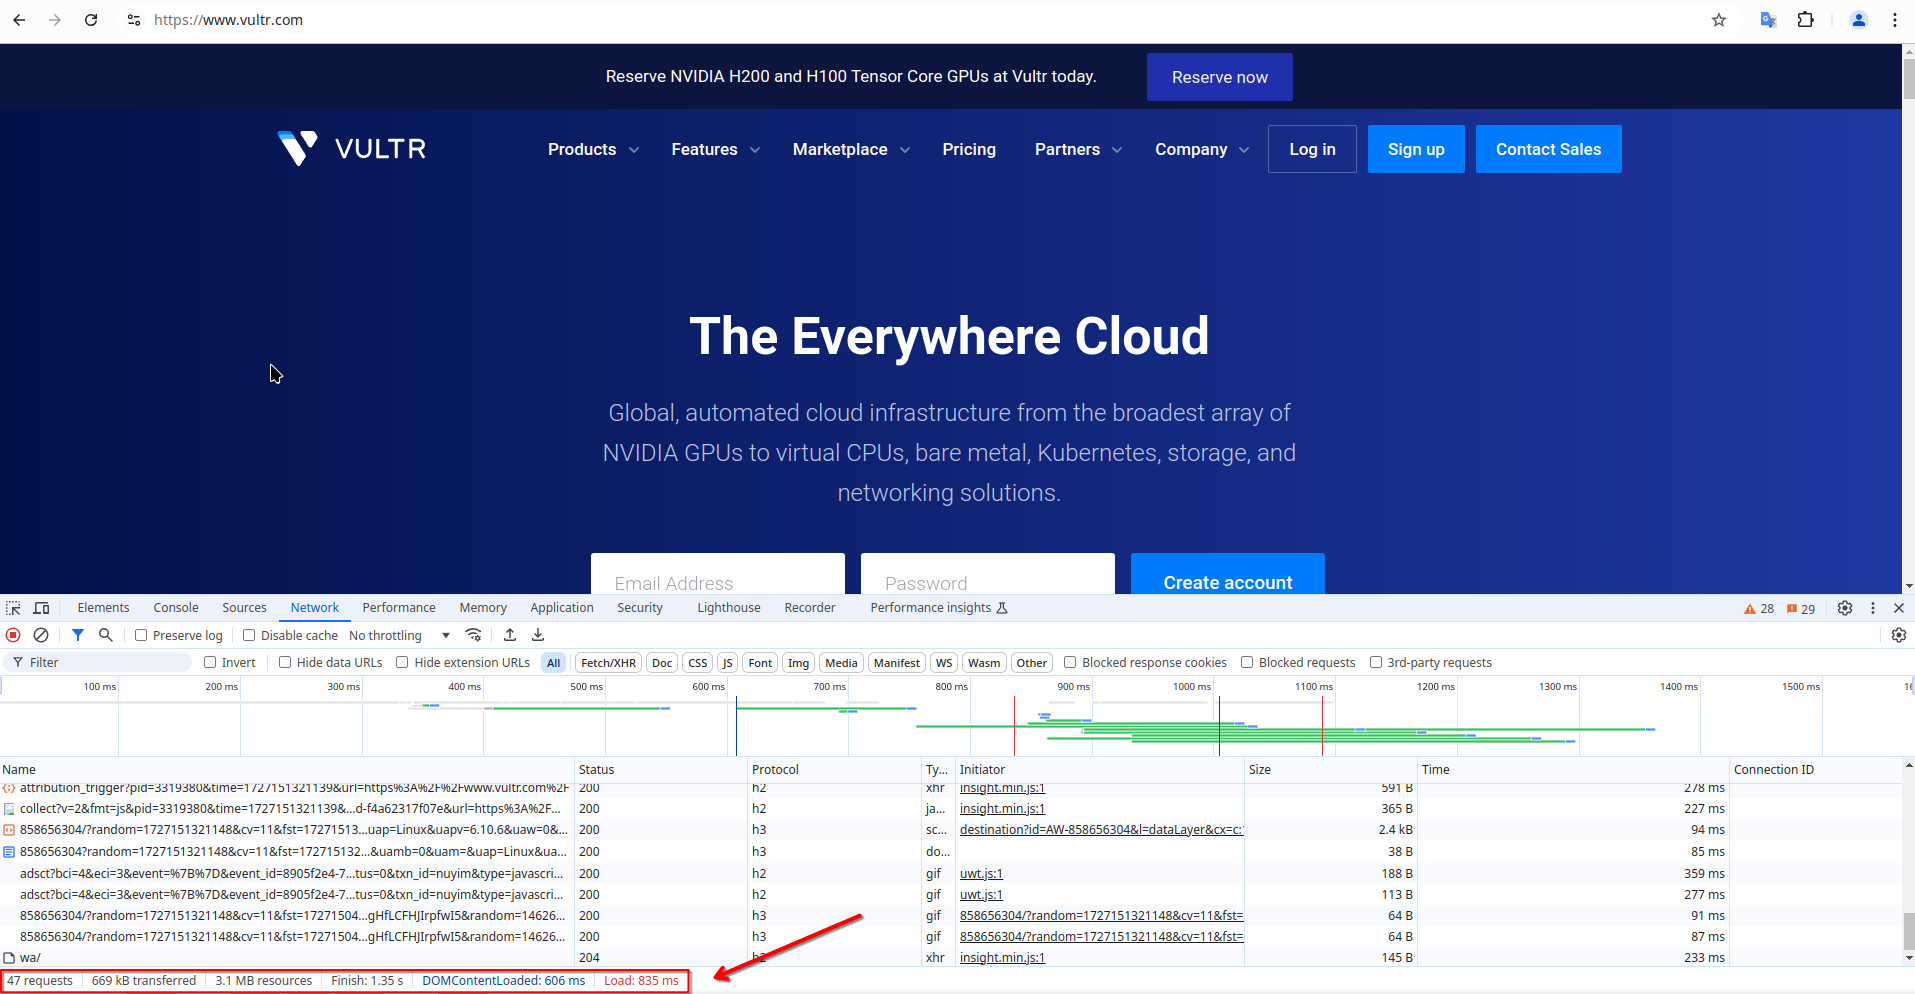
We can see here different values on the footer of Network panel. So let us understand what does it mean.
- 47 requests means that browser made 47 HTTP requests to fetch all the HTML, CSS, JS and any external websites.
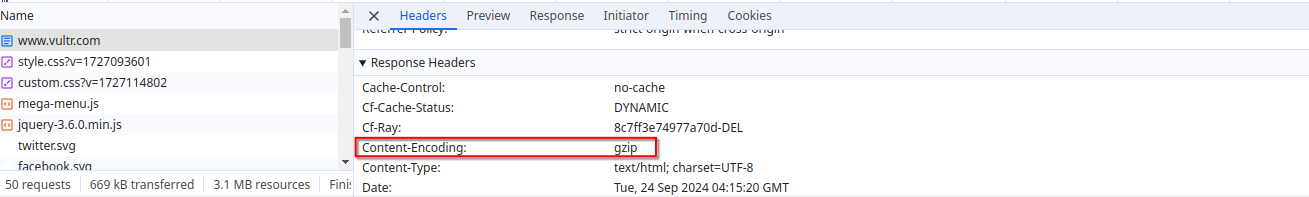
- 669 kB transferred and 3.1 MB resources – The HTTP resources are mainly compressed by HTTP server and then transferred to the browser. The browser then uncompresses the data and render it. This means that 3.1 MB data compressed as 669 kB is transferred from Vultr server to browser. In actual only 669 kilobytes of data is downloaded from the server but when browser uncompresses it, it comes to about 3.1 MB.
See the HTTP response header that tells that content is gzip compressed and then transferred.
- Finish, DOMContentLoaded and Load times:
- DOMContentLoaded is the least time among the three timing values. It means that in this time, browser has finished parsing the document. Images, CSS or Javascript may or may not be downloaded during this time.
- Load is the time taken to download all the initial resources like Javascript, CSS, images.
- Finish is the time taken to download all the initial resources and also any later AJAX calls. This time even increases in case of lazy loading of the page. If we scroll the webpage and some more AJAX calls are triggered to fetch resources or images are downloaded upon scrolling, then the Finish time will also increase.
The number of requests and finish time will keep increasing as the resources like images, external API content are loaded by doing AJAX calls or loading anything upon scrolling the page. But the DOMContentLoaded and Load times will remain same upon initial page load.